Spot Freight Market Report, June 2026: Tabi Pricing Pressure Index | Tabi Connect

Spot Market Intelligence · Monthly

Spot Freight Market Report, June 2026: the Tabi Pricing Pressure Index

Spot market intelligence that shows you where demand is heading before it reaches the load boards, so you know when to hold your rate and when to compete.

Published August 2026 · Based on spot freight quoting activity across the Tabi Connect network · Contract freight not included

Executive summary

Three numbers define June: the index held broker favored without a clear direction, awarded margin eased back, and quote volume pulled back after a strong run.

TPPI SCORE
32
Broker favored
AWARDED MARGIN
−1.0 pts
21.2% → 20.2% (4 week avg)
QUOTE VOLUME TREND
Down
−11.9% vs. prior 4 week avg
INSIGHTS
  • Awarded margin fell 1.0 points month over month, from 21.2% to 20.2%, with gains accelerating week over week.
  • At 20.2%, awarded margin is 5.7 points above the historical average of 14.5%. Brokers are keeping more on each load than they normally do.
  • Average haul length held steady at roughly 662 miles, so there was no meaningful shift in lane mix behind the margin move.

The TPPI stands at 32, firmly in broker favored territory. The 4 week average of 31 is in line with the 8 week average of 29, so leverage is holding steady rather than shifting decisively, and the latest week eased 5 points. Brokers retain pricing power on the spot side, with limited near term room for shippers to compress it.

Three things drove the period. Awarded margin compressed from 21.2% to 20.2%, the quote to market spread widened from 19.6% to 20.2%, and quote volume fell 11.9%. All three are 4 week rolling averages and line up with the figures above.

TPPI trend

Composite index from 0 to 100, weekly readings from January 2025 to present. When the index rises, the market is moving shipper favored. When it falls, brokers recover pricing power.

Line chart of the Tabi Pricing Pressure Index from January 2025 to June 2026, climbing to a peak near 74 in February and March 2025, easing through mid year, falling sharply to a low near 9 in December 2025, and recovering gradually to 32 by June 2026
Tabi Pricing Pressure Index, weekly readings. Source: Tabi Connect spot freight quoting data, January 2025 to June 2026.
INSIGHTS
  • TPPI sits at 32, firmly in broker favored territory. The reading moved down 5 points week over week.
  • The 4 week average of 31 is in line with the 8 week average of 29, so there is no directional trend.

Quote to market spread

How far above or below the market benchmark brokers are quoting, as a percentage of the market rate. Based on every submitted quote regardless of whether it won the load, so it reflects how confident brokers are when they price.

+20.2% above market · 4 week avg ▲ 0.5 ppts MoM
Line chart of quote to market spread from January 2025 to June 2026, narrowing toward 0% by April 2025, rising through the year with a sharp spike near 32% in December 2025, then oscillating between roughly 10% and 25% through June 2026
Quote to market spread, 4 week rolling average. Source: Tabi Connect spot freight quoting data, January 2025 to June 2026.
INSIGHTS
  • Brokers are quoting 20.2% above market on the 4 week average, with last week rebounding to 25.3%.
  • The spread widened by 0.5 percentage points month over month, moving from 19.6% to 20.2%. Brokers spent much of June protecting margin in a market that kept moving on them, and the wider spread is where that shows up.

Shipper size segmentation

Spot market shippers are grouped into three tiers by average weekly quote volume. Tier assignment uses each shipper's all time spot activity, while every metric shown reflects the most recent 4 weeks.

Regular

10 to 100 quotes per week on avg
Shippers
343
Quote volume
6.6%
Win rate
4.50%
Awarded margin
18.2%
Avg quoted price
$2,835
Avg market rate
$2,445
Spread vs. market
+15.9%

High Frequency

100 to 1,000 quotes per week on avg
Shippers
308
Quote volume
39.1%
Win rate
2.82%
Awarded margin
21.2%
Avg quoted price
$2,849
Avg market rate
$2,384
Spread vs. market
+19.5%

Enterprise

More than 1,000 quotes per week on avg
Shippers
43
Quote volume
54.3%
Win rate
0.37%
Awarded margin
17.2%
Avg quoted price
$2,697
Avg market rate
$2,217
Spread vs. market
+21.6%

Awarded margin by shipper size

Weighted average margin on won loads, by tier.

Regular
18.2%
High Frequency
21.2%
Enterprise
17.2%
INSIGHTS
  • Enterprise shippers deliver 1.0 points lower awarded margin than Regular shippers. High volume accounts leverage scale to drive harder pricing.
  • Enterprise shippers win at a rate 4.14 points lower than Regular shippers, 0.37% against 4.50%. They spread each shipment across more brokers, so no single broker captures much of the award even when the freight is moving.

Awarded volume trend

Month over month change in the share of quotes that convert to awarded freight. A positive month means shippers converted a larger share of quote requests into awarded loads than the month before.

JUN 2026 VS MAY 2026
−10.2% month over month change in the awarded share of quotes
MonthMoM change
Jun 2026 Current−10.2%
May 2026+47.5%
Apr 2026−18.6%
Mar 2026+13.9%
Feb 2026+18.3%
Jan 2026−10.4%

Awarded rate (win rate) cohorts

Shippers grouped by win rate, meaning awarded spot quotes divided by total spot quotes. Shows how awarded margin and market spread change as shippers get more or less selective about what they award.

Win rate bucketAwarded marginMarket spreadTotal quotes
Under 1%20.3%+25.0%35.1%
1 to 2%16.5%+16.6%13.4%
2 to 4%17.2%+24.1%16.0%
Over 4%19.1%+19.0%35.6%
INSIGHTS
  • Shippers awarding more than 4% of quotes generate 1.2 points less awarded margin than those awarding under 1%, at 19.1% against 20.3%.
  • The best awarded margin shows up in the Under 1% win rate cohort at 20.3%. This is the range where brokers win enough freight to make it worth the effort while still holding pricing power, and it is the clearest sweet spot in the data.
  • Market spread does not track selectivity cleanly either. It is widest in the Under 1% cohort at 25.0%, where brokers quote high on freight that rarely converts, and tightest in the 1 to 2% cohort at 16.6%. Spread on its own is a weak predictor of how a shipper awards.

Equipment type breakdown

Spot market metrics broken out by trailer and equipment type, covering effectively all spot quote volume.

Equipment typeTotal quotesWin rateAwarded marginMarket spreadVolume share
Van64.8%1.75%19.6%+21.1%
Reefer31.9%0.60%15.2%+24.7%
Flatbed3.4%2.20%17.1%+27.0%
INSIGHTS
  • Van carries 64.8% of spot quote volume at a 1.75% win rate and 19.6% awarded margin. It sets the baseline for the whole market.
  • Van holds the highest awarded margin at 19.6%, while reefer is the tightest at 15.2%. The 4.4 point gap between them comes down to how capacity behaves in each segment.
  • Flatbed quotes run 27.0% above market against van at 21.1%, so brokers price flatbed with more headroom. Thinner, more specialized capacity gives them room to do it.

Point changes in this report are calculated from unrounded values, so they may differ by 0.1 from the difference of the rounded percentages shown.

Frequently asked questions

What is the Tabi Pricing Pressure Index (TPPI)?

The TPPI is a composite index from 0 to 100 that tracks weekly pricing pressure in the spot freight market using spot freight quoting activity. A rising index means the market is moving shipper favored, so shippers gain leverage and brokers have to quote more competitively. A falling index means the market is moving broker favored, so brokers recover pricing power and awarded margin tends to improve. Contract freight is not included.

What does a broker favored spot market mean for freight brokers?

A broker favored market means brokers hold more pricing power on spot freight. Brokers can generally quote with less discounting and still win freight, which supports awarded margin. It also tends to coincide with a narrower quote to market spread, since brokers do not need to price as far above the market benchmark to stay competitive.

How is awarded margin measured in this report?

Awarded margin is measured against broker baseline pricing rather than spot truck rates, and is reported as a 4 week rolling average unless noted otherwise. It reflects the margin brokers keep on the loads they actually win.

How often does Tabi Connect publish spot market intelligence?

Tabi Connect publishes the Spot Market Intelligence report monthly, drawing on spot freight quoting activity across its broker network from the prior month.

Price this market at the speed it moves

When quote to market spread and awarded margin move together, the brokers who reprice fastest keep the most freight. Tabi's API returns freight quotes in about 3 seconds, and RPA based rates return in under 50 seconds, so your desk is never quoting on last week's market.

See Tabi in action

Want this data in your TMS? Tabi Connect integrates with 70+ shipper platforms and bid boards, including CargoChief, Transfix, e2open, BluJay/E2open, MercuryGate, Truckstop, DAT, and FreightWaves SONAR.

Spot Freight Market Report, July 2026: Tabi Pricing Pressure Index | Tabi Connect

Spot Market Intelligence · Monthly

Spot Freight Market Report, July 2026: the Tabi Pricing Pressure Index

Spot market intelligence that shows you where demand is heading before it reaches the load boards, so you know when to hold your rate and when to compete.

Published August 2026 · Based on spot freight quoting activity across the Tabi Connect network · Contract freight not included

Executive summary

Three numbers define July: the index moved deeper into broker favored territory, awarded margin gave some of that back, and quote volume kept climbing.

TPPI SCORE
36
Broker favored
AWARDED MARGIN
−4.5 pts
21.4% → 16.9% (4 week avg)
QUOTE VOLUME TREND
Uptrend
+15.2% vs. prior 4 week avg
INSIGHTS
  • Awarded margin fell 4.5 points month over month, from 21.4% to 16.9%, though the pace of decline slowed week over week.
  • At 16.9%, awarded margin still sits 2.2 points above the historical average of 14.7%. Brokers are keeping more on each load than they normally do.
  • Quote volume is up 15.2% versus the prior 4 week average. More freight is being shopped to spot, consistent with rising shipper demand or an increase in contract tender rejections.
  • Volume is growing while awarded margin compresses. Brokers are capturing more freight by pricing tighter.
  • Average haul length held steady at roughly 674 miles, so there was no meaningful shift in lane mix behind the margin move.

The TPPI stands at 36, firmly in broker favored territory. The 4 week average of 26 is running below the 8 week average of 29, a gradual shift toward brokers, and the latest week alone picked up 10 points. Market pricing is becoming more predictable.

Three things drove the period. Awarded margin compressed from 21.4% to 16.9%, the quote to market spread narrowed from 22.6% to 18.8%, and quote volume rose 15.2%. All three are 4 week rolling averages and line up with the figures above.

A note on interpretation: awarded margin is measured against broker baseline pricing, not spot truck rates. When both awarded margin and quote to market spread compress together, brokers are pricing closer to market to remain competitive, a sign the market is shifting broker favored with shippers holding less leverage on the spot side.

TPPI trend

Composite index from 0 to 100, weekly readings from January 2025 to present. When the index rises, the market is moving shipper favored. When it falls, brokers recover pricing power.

Line chart of the Tabi Pricing Pressure Index from January 2025 to July 2026, climbing to a peak near 74 in March 2025, easing through mid year, falling sharply to a low near 9 in December 2025, and recovering gradually to 36 by July 2026
Tabi Pricing Pressure Index, weekly readings. Source: Tabi Connect spot freight quoting data, January 2025 to July 2026.
INSIGHTS
  • TPPI sits at 36, firmly in broker favored territory. The reading moved up 10 points week over week.
  • The 4 week average of 26 is running below the 8 week average of 29, confirming a sustained broker favored trend.

Quote to market spread

How far above or below the market benchmark brokers are quoting, as a percentage of the market rate. Based on every submitted quote regardless of whether it won the load, so it reflects how confident brokers are when they price.

+18.8% above market · 4 week avg ▼ 3.9 ppts MoM
Line chart of quote to market spread from January 2025 to July 2026, narrowing toward 0% by April 2025, rising through the year with a sharp spike above 30% in December 2025, then oscillating between roughly 10% and 28% through July 2026
Quote to market spread, 4 week rolling average. Source: Tabi Connect spot freight quoting data, January 2025 to July 2026.
INSIGHTS
  • Brokers are quoting 18.8% above market on the 4 week average, with last week easing back to 15.7%. The pullback likely reflects increased rate confidence and quoting competition as capacity became more predictable than it was for the majority of a volatile July.
  • The spread narrowed by 3.9 percentage points month over month, moving from 22.6% to 18.8%. Brokers are pulling quotes closer to market, which reflects less confidence in premium pricing.

Shipper size segmentation

Spot market shippers are grouped into three tiers by average weekly quote volume. Tier assignment uses each shipper's all time spot activity, while every metric shown reflects the most recent 4 weeks.

Regular

10 to 100 quotes per week on avg
Shippers
344
Quote volume
6.8%
Win rate
4.43%
Awarded margin
17.4%
Avg quoted price
$2,771
Avg market rate
$2,435
Spread vs. market
+13.8%

High Frequency

100 to 1,000 quotes per week on avg
Shippers
328
Quote volume
37.7%
Win rate
2.86%
Awarded margin
16.9%
Avg quoted price
$2,790
Avg market rate
$2,396
Spread vs. market
+16.5%

Enterprise

More than 1,000 quotes per week on avg
Shippers
47
Quote volume
55.5%
Win rate
0.22%
Awarded margin
16.2%
Avg quoted price
$2,783
Avg market rate
$2,291
Spread vs. market
+21.5%

Awarded margin by shipper size

Weighted average margin on won loads, by tier.

Regular
17.4%
High Frequency
16.9%
Enterprise
16.2%
INSIGHTS
  • Awarded margin barely moves across the three tiers, holding between 16.2% and 17.4%. A shipper's size does very little to change how much a broker keeps per load. Size moves win rate far more than it moves margin.
  • Enterprise shippers win at a rate 4.21 points lower than Regular shippers, 0.22% against 4.43%. They spread each shipment across more brokers, so no single broker captures much of the award even when the freight is moving.

Awarded volume trend

Month over month change in the share of quotes that convert to awarded freight. A positive month means shippers converted a larger share of quote requests into awarded loads than the month before.

JUL 2026 VS JUN 2026
−3.7% month over month change in the awarded share of quotes
MonthMoM change
Jul 2026 Current−3.7%
Jun 2026+1.3%
May 2026+46.8%
Apr 2026−18.7%
Mar 2026+14.2%
Feb 2026+18.4%
Jan 2026−10.4%

Awarded rate (win rate) cohorts

Shippers grouped by win rate, meaning awarded spot quotes divided by total spot quotes. Shows how awarded margin and market spread change as shippers get more or less selective about what they award.

Win rate bucketAwarded marginMarket spreadTotal quotes
Under 1%17.3%+21.5%35.4%
1 to 2%13.9%+15.1%11.9%
2 to 4%16.7%+20.0%14.1%
Over 4%14.2%+11.7%38.6%
INSIGHTS
  • Shippers awarding more than 4% of quotes generate 3.1 points less awarded margin than those awarding under 1%, at 14.2% against 17.3%.
  • The best awarded margin shows up in the Under 1% win rate cohort at 17.3%. This is the range where brokers win enough freight to make it worth the effort while still holding pricing power, the clearest sweet spot in the data.
  • Market spread does not track selectivity cleanly either. It is widest in the Under 1% cohort at 21.5%, where brokers quote high on freight that rarely converts, and tightest in the Over 4% cohort at 11.7%. Spread on its own is a weak predictor of how a shipper awards.

Equipment type breakdown

Spot market metrics broken out by trailer and equipment type, covering effectively all spot quote volume.

Equipment typeTotal quotesWin rateAwarded marginMarket spreadVolume share
Van63.0%1.97%14.5%+16.9%
Reefer33.4%0.60%14.7%+20.9%
Flatbed3.5%2.28%13.3%+23.3%
INSIGHTS
  • Van carries 63.0% of spot quote volume at a 1.97% win rate and 14.5% awarded margin. It sets the baseline for the whole market.
  • Reefer holds the highest awarded margin at 14.7%, while flatbed is the tightest at 13.3%. The 1.3 point gap between them comes down to how capacity behaves in each segment.
  • Flatbed quotes run 23.3% above market against van at 16.9%, so brokers price flatbed with more headroom. Thinner, more specialized capacity gives them room to do it.

Point changes in this report are calculated from unrounded values, so they may differ by 0.1 from the difference of the rounded percentages shown.

Frequently asked questions

What is the Tabi Pricing Pressure Index (TPPI)?

The TPPI is a composite index from 0 to 100 that tracks weekly pricing pressure in the spot freight market using spot freight quoting activity. A rising index means the market is moving shipper favored, so shippers gain leverage and brokers have to quote more competitively. A falling index means the market is moving broker favored, so brokers recover pricing power and awarded margin tends to improve. Contract freight is not included.

What does a broker favored spot market mean for freight brokers?

A broker favored market means brokers hold more pricing power on spot freight. Brokers can generally quote with less discounting and still win freight, which supports awarded margin. It also tends to coincide with a narrower quote to market spread, since brokers do not need to price as far above the market benchmark to stay competitive.

How is awarded margin measured in this report?

Awarded margin is measured against broker baseline pricing rather than spot truck rates, and is reported as a 4 week rolling average unless noted otherwise. It reflects the margin brokers keep on the loads they actually win.

How often does Tabi Connect publish spot market intelligence?

Tabi Connect publishes the Spot Market Intelligence report monthly, drawing on spot freight quoting activity across its broker network from the prior month.

Price this market at the speed it moves

When quote to market spread and awarded margin move together, the brokers who reprice fastest keep the most freight. Tabi's API returns freight quotes in about 3 seconds, and RPA based rates return in under 50 seconds, so your desk is never quoting on last week's market.

See Tabi in action

Want this data in your TMS? Tabi Connect integrates with 70+ shipper platforms and bid boards, including CargoChief, Transfix, e2open, BluJay/E2open, MercuryGate, Truckstop, DAT, and FreightWaves SONAR.

Every competitor solves one piece of the quoting problem: Tabi solves it all from spot quotes, TMS portals, contract bids, RFPs, and email in a single platform, in seconds.

Freight brokers receive hundreds of rate requests every day. Most teams are still pricing manually pulling from multiple rate sources, blending market data with tribal knowledge, and hoping the response goes out before a competitor beats them to it. The spot market does not wait. Shippers do not wait. And the brokerages that cannot keep up are leaving freight on the table every single day.

Tabi Connect automates the entire quoting workflow, embedding directly into the channels brokers already use, applying intelligent pricing rules, and responding in seconds rather than minutes. The result is faster quotes, more wins, better margins, and a pricing intelligence layer that grows stronger as your data accumulates.

Tabi Connect vs. the Competition

The quoting gap is where freight is won or lost. Here is what separates Tabi from every alternative.

CAPABILITY TABI CONNECT COMPETITOR A COMPETITOR B
Full-Stack RMS Connectivity Tool Email AI Tool
Complete Rate Management System ✓  YES ✕  NO ✕  NO
Quoting across all 5 channels; API Integrations, Shipper TMS platforms, email, portals and bidboards ✓  YES ✕  NO ✕  NO
Native email quote automation ✓  YES ✕  NO ✓  YES
Shipper TMS portal quoting ✓  YES ✓  YES ✕  NO
RFP / contract bid management ✓  YES ✕  NO ✕  NO
Margin protection parameters ✓  YES ✕  NO ✕  NO
70+ TMS integrations ✓  YES 20+ ✕  NO
Wallet share / missed revenue analytics ✓  YES ✕  NO ✕  NO
Pricing intelligence & market indices ✓  YES ✕  NO ✕  NO
Spot-to-contract lane conversion ✓  YES ✕  NO ✕  NO
Built exclusively for freight brokers ✓  YES ✕  NO ✕  NO

5 Reasons the Top Freight Brokerages Choose Tabi Connect

01. The Only Tool That Covers All Five Quoting Channels.

Spot bids. Shipper TMS portals. Contract RFPs. Bid boards. Email. Most brokerages manage all five with no single system of record. Tabi is the only platform that automates the entire workflow across every channel so your team stops losing loads in the gaps between tools.

02. AI-Powered Pricing Rules in Plain English No Code Required.

Tabi’s AI Dynamic Business Rules engine lets you encode your best quoting agent’s knowledge into rules that apply consistently across the team, every quote, every channel in plain English, with no developer needed. When she goes on vacation, your win rate does not drop.

03. Quote in 2 Seconds. Win the Loads You Should Be Winning.

The largest brokerages in the country automate 100% of email quotes in under 30 seconds. Tabi delivers final rates in 2 seconds. The gap between brokers who respond in seconds versus minutes is already showing up in win rates. Some brokers respond to only 8% of available quotes missing tens of millions in potential revenue. Tabi closes that gap.

04. See Exactly What Freight You Are Missing and Win It Back.

Tabi’s Wallet Share analytics show you how much eligible freight you are not quoting, broken down by customer, lane, and channel. Most brokers are blind to their own missed opportunity. Tabi makes it visible and gives you the tools to act on it before a faster competitor does.

05. Built by Freight Industry Veterans. Proven at Scale.

Tabi’s co-founder co-created DAT RateView, the most widely used rate benchmarking tool in the freight brokerage industry. The team that built the standard built what comes next. Tabi has grown from $620K to $4.5M ARR entirely through customer revenue, with zero outside capital raised. Every feature earned its keep with paying customers.

What Freight Brokerages Say After Switching

“Tabi has transformed quoting from a time-consuming, reactive task into a proactive, strategic growth lever. The biggest value has been our ability to quote with speed, precision, and confidence, leading to higher wins and stronger margins.”

— Customer, AJC Freight Solutions

“The biggest value Tabi Connect has brought is automation that lets us do more with the same resources, freeing our team to focus on other high-impact areas of the business.”

— Customer, Direct Connect Logistix

“One Tabi customer — a $4B+ freight brokerage — attributed $100M in new revenue in year one. They also used Tabi data to convert spot lanes into contract lanes, moving from transactional vendor to strategic advisor.”

— Case Study Result, Fortune 100 Freight Brokerage

See What 20+ of the Top 100 Freight Brokerages Already Know. No slides. Just the platform. 15 minutes is all it takes. Request a Demo now!

If your freight brokerage is evaluating a rate management system or quoting automation platform, most tools will look similar on the surface. The difference shows up after implementation, when the tool meets your actual workflow.

Evaluating what matters in a real brokerage environment — not in a demo

Most tools will look identical during sales pitches: they all show rates, talk about automation, and claim to improve speed. This roadmap is designed to help operations leaders identify structural strengths from generic features before launching implementation.

1

Can it quote where your requests actually show up?

Freight does not come through one channel. Your team is working across shipper TMS platforms, shipper portals, bid boards, and email. If your system only covers part of that, your process is still fragmented.

WHAT TO LOOK FOR

WHAT TO WATCH FOR

Many tools stop at “rate generation.” They give you a number, then expect your team to apply quoted markup and submit manually. That is not quoting automation. That is a pricing tool with extra steps.

WHY IT MATTERS  If your team is still stitching together the workflow across channels, you will continue to miss volume, slow down response time, and introduce inconsistency.

2

Does it integrate in the way your customers operate?

Integration is one of the most overused words in this category. The real question is whether the system can connect to the platforms your customers use, even when those platforms are inconsistent or lack APIs.

WHAT TO LOOK FOR

WHAT TO ASK

WHY IT MATTERS  API-only solutions work in clean environments. Most brokerages do not operate in clean environments. If your system cannot handle both, automation will break across part of your network.

3

Can your team control pricing logic without engineering?

Speed without control creates risk, and control without speed creates bottlenecks. The systems that hold up over time give business users direct control over pricing logic.

WHAT TO LOOK FOR

WHAT TO WATCH FOR

Many tools describe logic as simple if-then rules or static fields. That works for basic scenarios, but breaks under real-world complexity.

WHY IT MATTERS  If pricing logic cannot evolve quickly, your team will fall back to manual overrides. That is where consistency and markup control start to break down.

4

Does it have governance built in, not added on?

As soon as you give teams the ability to move faster, you need guardrails. Without them, one bad change can impact an entire book of business.

WHAT TO LOOK FOR

WHAT THIS LOOKS LIKE IN PRACTICE

In real operations, markets shift quickly. Weather events, capacity swings, or customer changes require immediate adjustments. The system should allow you to react in real time without creating downstream risk.

WHY IT MATTERS  The goal is not just faster quoting — it is faster quoting with control.

5

Does it capture every quote and show you what happened?

Most brokerages do not have a complete view of quoting activity. Some quotes live in email. Others in portals. Others never get sent at all.

WHAT TO LOOK FOR

WHAT TO WATCH FOR

Some tools show only the quotes that were processed through their system. That creates a partial view and limits your ability to improve.

WHY IT MATTERS  You cannot improve what you cannot see. Full quote capture is what turns quoting into a measurable, improvable process.

6

Does it actually reduce manual work, or just move it around?

Many tools claim automation, but still rely heavily on user input. The real test is whether your team is doing less manual work after implementation.

WHAT TO LOOK FOR

WHAT TO WATCH FOR

If your reps are still copying, pasting, and logging into multiple systems, the tool is not solving the core problem.

WHY IT MATTERS  Reducing manual work is what allows your team to scale output without adding headcount.

7

Can it scale with your business without breaking your workflow?

This is where many tools fail after the initial rollout. They work for a small team or a limited set of customers, but struggle as volume increases or as the shipper network expands.

WHAT TO LOOK FOR

WHY IT MATTERS  A system that only works at low volume will not protect target markup when the market shifts or when your business scales.

8

What happens 30 to 60 days after you go live?

This is the question most buyers do not ask early enough. Initial demos focus on features, but the real test is adoption.

WHAT TO LOOK FOR

WHAT TO WATCH FOR

Complex systems often fail because the team does not use them consistently. That leads to partial adoption, which recreates the same problems you started with.

WHY IT MATTERS  If the system is not used consistently, it cannot deliver consistent results.

Final Perspective

Most rate management tools will check a few of these boxes, but very few solve the entire quoting workflow. Tabi Connect was built to cover the full process—from the rate request coming in to the quote going out across email, shipper platforms, portals, and bid boards. If you are evaluating options, the goal is not to find a better rate tool. It is to find a system that holds up in the way your team actually works.

Speak with an Expert today!

Quick definition

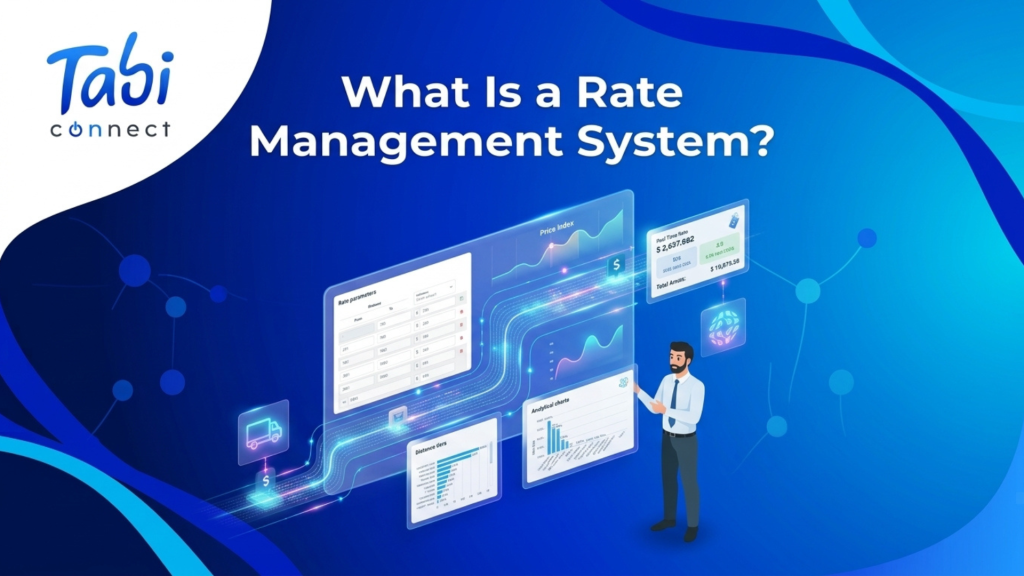
A Rate Management System (RMS) is software that automates freight quoting and turns every request into pricing data brokers can act on. It captures rate requests from shipper platforms, bid boards, and email, prices each one using rules the broker defines, and submits the quote back to the shipper, in some cases in as little as two seconds, without a rep manually handling the request. Every request is captured in full, whether it turns into a submitted quote, gets routed for manual review, or falls outside what the broker wants to quote at all. When a load is awarded, that outcome is tracked against the original quote too, so brokers can see quoted markup next to what was actually awarded. The result is a complete record of what got quoted, what got skipped, and what won, instead of a summary limited to the loads that closed.

Freight brokers use the term in a few different ways, so it helps to be precise. An RMS is not a rate lookup tool, and it is not a transportation management system. It is the layer that sits between the two, turning a rate request into a submitted quote without a person doing the mechanical steps by hand.

The rest of this page covers what an RMS actually does, why it exists as a separate system from a TMS, how brokerages use quoting data as a pricing strategy instead of a reporting exercise, and what to look for if you are evaluating one.

What a Rate Management System Does

An RMS is built around five core functions. Together they cover the full quoting cycle from the moment a request arrives to the moment a win or loss is recorded.

Multi channel request capture

Connects to shipper TMS platforms, bid boards, and email using API where available and RPA where it is not, so requests from every channel land in one place.

Configurable pricing logic

Markup rules, lane specific adjustments, and customer tiers are set through a browser interface and applied the same way on every quote, with no coding involved. Pricing logic doesn’t have to be built as traditional if/then statements either. AI pricing rules let brokers set quoting logic in plain language, and those rules stack on top of the rest of the pricing setup instead of replacing it. That means a broker can adapt to a quick change in a lane without having to go in and manage how each individual rule operates.

Automated quote submission

Quotes go back to the shipper directly, without a rep in the loop for requests that fall within the defined pricing rules.

Control Tower and exception routing

Not every request should go out automatically, and Control Tower is where a broker decides that. It routes quotes to a human review queue whenever a broker wants a person in the loop, whether that’s a specific shipper, a complex lane, or any request that falls outside the defined pricing parameters. It’s optional and configurable per lane or account, so brokers can let the rules run on what they trust and keep manual review on the parts of the book where they still want a person checking the quote before it goes out.

Quoting analytics

Every request is logged whether it resulted in a quote or not, giving operations a complete view of response rate, win rate, and quoted markup by lane. Instead of building a report to find out why win rate dropped on a lane, operations can ask the system directly and get an answer from the underlying quoting data, without pulling it manually.

Why an RMS Is a Separate System From a TMS

The short answer is that a TMS and an RMS are built to solve different problems, not the same problem at different price points.

A TMS is architected around the lifecycle of a load that already exists. Once a load is awarded, it moves through tendering, tracking, documentation, and invoicing, each stage anchored to a single record. That’s a sequential, one-record-at-a-time workflow, and TMS platforms are built well for it.

Quoting is a different kind of problem. A brokerage fielding requests across shipper platforms, bid boards, and email is handling high volume, sub-second response expectations, and parallel requests where most never turn into a load at all. That’s not a lifecycle problem, it’s a throughput problem. Building real automation for that means the system has to be architected for volume and speed from the start, not added as a module on top of software designed to manage one load through its stages.

That’s why most TMS quoting modules stay at basic rate lookup. It’s not a feature gap that will close with the next release, it’s a mismatch between what the system was built to do and what quoting actually requires. A rate management system is purpose-built for the quoting side, and it connects to the TMS once a quote is awarded and becomes a load.

Pricing Data as a Strategic Asset, Not Just a Report

Most brokerages still price off rep memory and experience. A rep knows a lane, has a feel for what it’s trading at, and quotes off that instinct under time pressure. That works until it doesn’t scale: it doesn’t transfer when a rep leaves, it’s inconsistent across a team, and there’s no way to see whether the brokerage is systematically over or under quoted markup on specific lanes versus the market.

An RMS changes what’s possible here because every quote becomes a structured data point instead of a decision that lived in someone’s head. Response rate, win rate, and quoted markup by lane turn pricing into something a brokerage can actually manage and improve, rather than something that depends on who happens to be working a given lane that day. Brokerages that treat their quoting data this way are working from a real pricing strategy. Brokerages still quoting off memory are competing on instinct, and instinct doesn’t hold up as request volume grows.

Rate Management System vs. TMS vs. Manual Quoting

The most common confusion is between an RMS and a TMS, since most TMS platforms include some quoting functionality. The table below shows where each approach holds up and where it does not.

FunctionManual QuotingTMS Quoting ModuleRate Management System
Response timeResponse time varies widely by rep and by how many requests are queuedBuilt for occasional use, not timed for spot responseAs little as 2 seconds
Channel coverageLimited to channels a rep actively checksRate lookup within the TMS interface onlyShipper platforms, bid boards, and email simultaneously
Pricing logicApplied inconsistently depending on the rep and time pressureBasic rate lookup, no configurable markup rulesBroker defined logic, applied the same way every time
VisibilityNo structured record of missed or lost requestsReporting limited to loads that were bookedCaptures every request, quote, win, and loss
ScalabilityCapped by headcountNot built for high daily request volumeProcesses requests simultaneously regardless of volume

Rate Management System vs. Rate Intelligence Tools

The other point of confusion is with rate intelligence subscriptions like DAT RateView, Sonar, Truckstop RateCast, and C4 Connections. Those tools provide market rate data. They tell you what a lane is trading at. They do not capture requests, apply your markup rules, or submit a quote. An RMS connects to those subscriptions through API and uses the data they provide as one input in a quote it builds and sends automatically. Brokers keep their existing rate intelligence relationships and add the RMS as the automation layer on top.

Who Uses a Rate Management System

RMS platforms are built for freight brokerages and 3PLs that receive spot quote requests across multiple shipper platforms. The point at which a brokerage typically starts evaluating one is when manual quoting is visibly constraining how many requests get answered, or when response time is costing loads that were priced correctly but arrived too late.

A note on where this definition comes from Tabi Connect’s pricing logic was designed by Joel McGinley, co-creator of DAT RateView, one of the freight industry’s primary rate benchmarking tools. That background shapes how this page defines the category, from the pricing and data side of freight, not just the software side.

Frequently Asked Questions

What does RMS stand for in freight?

RMS stands for rate management system. In freight brokerage, it refers to software that automates the process of receiving a rate request, pricing it according to broker defined logic, submitting the quote back to the shipper, and logging the outcome so the brokerage has structured data on response rate, win rate, and quoted markup.

Is a rate management system the same as a TMS?

No. A TMS manages a load after it has been awarded, covering carrier tendering, tracking, documentation, and invoicing. A rate management system operates before the award, handling the quoting workflow. The two are built on different architectures because they solve different problems, sequential load management versus high-volume, parallel request handling. Most brokerages run both, and they connect to each other.

Is a rate management system the same as a rate intelligence tool like DAT RateView?

No. A rate intelligence tool provides market rate data that a person or system references when pricing a load. A rate management system pulls from those rate sources automatically and uses them to build and submit a quote. Brokers keep their rate intelligence subscriptions and add an RMS on top.

Do freight brokers need a rate management system?

Brokers handling a low volume of quote requests can often manage manually. Once a team is fielding dozens of requests a day across several shipper platforms, response time and consistency typically start to suffer, which is the point at which an RMS addresses a measurable operational gap.

How does a rate management system work?

An RMS connects to shipper platforms, bid boards, and email through API and RPA to capture rate requests as they arrive. It applies the broker’s pricing logic automatically, pulls current market rates from the broker’s existing rate sources, and submits the quote, in some cases in as little as two seconds, without a rep in the loop for routine requests.

What features should a rate management system have?

At minimum, an RMS should offer multi channel request capture, configurable pricing logic with no coding required, automated quote submission, exception routing for requests outside defined parameters, and analytics that capture every request whether or not it resulted in a quote.

See a Rate Management System in Action

Tabi Connect is a rate management system built for freight brokers. It connects to 70+ shipper platforms, applies your pricing logic automatically, and submits quotes in as little as 2 seconds.

Book a Demo now!

Not all freight rate management systems are built the same way. The category includes everything from lightweight quoting tools to full automation platforms, and the differences matter when a brokerage is quoting hundreds of loads per day across dozens of shipper connections. Choosing the wrong system doesn’t just mean paying for something that underdelivers. It means spending the next several months working around limitations that slow the operation down. 

These are the criteria that distinguish a rate management system built for scale from one that creates new bottlenecks. 

1. Real Integration Depth, Not Just Integration Count 

The first thing to look past is the integration list. Most RMS platforms will tell you they connect to a long list of shipper platforms. The more useful question is how those connections work. There are three types of shipper platform connections: 

Live API connections: The RMS communicates directly with the shipper’s system in real time. Rate requests are received and quotes are submitted without delay or manual steps. 

RPA connections: Robotic process automation mimics the actions a human would take in a shipper portal. Used for platforms that don’t offer a direct API. Still real-time, still automatic. 

Scheduled or manual exports: The RMS pulls data on a schedule, or requires manual downloads and uploads. This creates a lag between when the request is submitted and when the RMS sees it. 

The first two types support a competitive response time. The third doesn’t. Ask directly how each integration is handled and what the expected response window is per shipper platform. Tabi Connect uses API connections where available and RPA where not. 

2. Pricing Logic That the Broker Controls 

The value of a rate management system depends on how precisely a broker can define and enforce their pricing strategy. A system that locks logic behind vendor-controlled rules or requires IT involvement to update is a tool that constrains the brokerage’s strategy rather than serving it. 

Look for no-code configuration for markup targets, lane adjustments, accessorials, and equipment rules; real-time parameter updates from any browser, without an implementation ticket; support for 40+ simultaneous parameters so the logic can be as granular as the business requires; and exception thresholds that can be set and adjusted by the operations team, not the vendor. 

The pricing logic engine is where markup, and ultimately margin, is protected or lost. A brokerage that can’t quickly adjust rules as market conditions change will find itself either leaving money on the table or quoting outside competitive ranges. See how broker-defined pricing logic protects margin. 

3. Exception Handling That Is Visible and Actionable 

Every RMS will encounter rate requests that fall outside the defined parameters. How the system handles those exceptions determines whether they become missed loads or managed escalations. 

A well-built system flags exceptions, routes them to the right team or rep, and captures the exception data so patterns can be identified and addressed. A poorly built system lets them fall into a queue that nobody monitors, or requires manual checking to find requests that didn’t receive a response. 

Ask what percentage of exceptions typically get resolved, how exceptions are routed, and what reporting exists around exception patterns. A high exception rate that doesn’t decrease over time is a signal that the pricing logic needs refinement, and the right system makes that visible. 

4. Analytics That Cover the Full Quoting Funnel 

Most quoting operations track loads won and loads moved. The stronger signal is what happens before the award: how many requests came in, how many were quoted, how many weren’t, at what markup, and at what response time. 

A freight rate management system should capture every rate request, not just the ones that turned into quotes. That complete data set is what makes it possible to answer the questions that actually drive improvement: Which lanes are we consistently losing? Where is our response time causing us to miss the first wave? Which shippers are sending requests we never respond to? 

5. Implementation Time and IT Requirements 

An RMS that takes six months to implement and requires significant IT involvement isn’t the right tool for a brokerage that needs to solve a quoting problem now. Implementation complexity is a real evaluation criterion, not just a logistics detail. 

Questions to ask: Who handles the API and RPA configuration? Are virtual machines or custom infrastructure required from the customer? How many weeks from contract to go-live is realistic? 

Tabi Connect averages four to five weeks from proposal acceptance to go-live. The implementation team handles all integrations and configuration. The customer’s IT team is not required to provision or maintain infrastructure. 

6. A Pilot or Trial Option Before Full Commitment 

A rate management system is a significant operational change. Any vendor confident in their platform should offer a defined way to test it before full deployment. A pilot with a subset of shippers, a defined time window, and measurable results is how a brokerage confirms that the system does what it claims before expanding to full volume. 

Tabi Connect offers 30-day pilot programs with no long-term contract requirement. This lets brokerages evaluate response time, win rate impact, and exception handling with real shippers before committing. 

What to Look for at a Glance 

Criterion What to Ask 
Integration depth API or RPA? Scheduled exports? Expected response time per shipper? 
Pricing logic control No-code updates? How many parameters? Real-time adjustments? 
Exception handling How are exceptions routed? What exception data is captured? 
Analytics coverage Does the system capture requests that were not quoted? 
Implementation Who handles configuration? Time to go-live? IT involvement required? 
Pilot options Is a trial available before full commitment? 

Frequently Asked Questions About Evaluating a Freight Rate Management System 

What is the most important factor when choosing a freight rate management system? Integration depth matters more than integration count. A system with 100 listed connections that relies on scheduled exports is slower than one with 30 live API or RPA connections. Response time is where loads are won or lost, so the technology behind each integration is the most critical factor. 

How long does RMS implementation typically take? It varies by vendor and scope. Tabi Connect averages four to five weeks from proposal acceptance to go-live. Setup requires no virtual machines or infrastructure from the customer. All API connections and configurations are handled by the implementation team. 

Is a rate management system worth the investment for smaller brokerages? An RMS delivers the most immediate return for brokerages quoting 50 or more spot loads per week across multiple shipper platforms. For smaller operations, the question is whether manual quoting is creating a ceiling on growth. If the team can’t respond quickly enough to compete, the cost of the RMS is typically offset by the loads that would otherwise be missed. 

What should I test during a pilot? Focus on three things: response time per shipper, win rate against your baseline, and exception rate. A pilot that shows faster response, stable or improved win rates, and manageable exceptions is a clear signal the system is working. 

How do I evaluate the quoting analytics? Ask to see a live demo of the analytics dashboard and look specifically for data on requests that weren’t quoted. Any platform can show you loads won. The stronger indicator is whether the system captures the full quoting funnel, including the requests that went unanswered. 

See Tabi Connect’s Approach to Each of These Criteria 

Tabi Connect is a freight rate management system built for brokerages that need to quote at scale. It connects to 70+ shipper platforms, enforces broker-defined pricing logic with no coding required, and includes a 30-day pilot program.

Speak with a Rate Tech Expert now!

A freight rate management system is not a single feature. It’s a set of connected functions that, together, replace the manual quoting process for freight brokers. Understanding each function matters because brokerages often evaluate RMS platforms based on integration count or UI, when the more important question is whether the system actually covers all five of these areas. A gap in any one of them creates a bottleneck that undermines the others. 

Function 1: Multi-Channel Request Capture 

The first function is capturing rate requests from wherever they originate. For most freight brokers, that means shipper TMS platforms, load boards, and email. Some shippers submit requests through an API. Others use proprietary portals. Some still send free-form emails with load details buried in the message body. 

A freight rate management system connects to each of these channels without requiring reps to log in, retrieve requests, and manually enter data. For shipper platforms that support direct API connections, the integration runs in the background in real time. For platforms that don’t support API, robotic process automation (RPA) handles the retrieval, mimicking the steps a human rep would take without the manual overhead. 

This function is what enables volume. Without it, every rate request still lands in a rep’s queue, and the system is just a faster calculator rather than a true automation layer. 

Function 2: Broker-Defined Pricing Logic 

The second function is applying pricing logic that the broker controls. This is where the RMS enforces the brokerage’s strategy on every quote: which markup to target on which lanes, how to handle accessorials, which equipment types to accept, and what to do when market rates fall outside normal ranges. 

The distinction between a well-built pricing logic engine and a basic rate lookup is the number of parameters it can handle simultaneously. A rate lookup retrieves a market rate. A pricing logic engine applies 40 to 50 parameters, across lane, carrier network, markup targets, and accessorials, and produces a quote that reflects the broker’s actual business rules. 

In a manual quoting operation, this logic lives inside the heads of the most experienced reps. It’s valuable and difficult to replicate consistently. An RMS externalizes that logic into a rules-based system that applies it the same way every time, across every rep, every channel, and every time zone. 

Function 3: Automated Quote Submission 

The third function is returning the quote to the shipper without rep involvement. For API-connected shipper platforms, this can happen in under two seconds. For RPA-handled platforms, it takes slightly longer but still operates within a window that keeps the brokerage competitive. 

Response time has a direct effect on whether a quote wins. When a shipper submits a request to multiple brokers simultaneously, the first credible quote often sets the anchor for the conversation. Quotes that arrive late enter a pricing discussion that has already been framed by a competitor. 

Automated submission removes the rep from the critical path for routine quotes. Reps still handle exceptions, manage relationships, and work on accounts that require real analysis. The automation layer handles the volume that would otherwise fill their queues and slow the operation down. 

Function 4: Exception Management 

The fourth function is handling requests that fall outside the defined pricing parameters. Not every rate request fits the rules a broker has configured. A load with unusual dimensions, a lane outside the carrier network’s coverage area, or a request that triggers a markup threshold the broker has set as a floor, these need human review. 

A freight rate management system identifies those requests automatically, flags them as exceptions, and routes them to the appropriate rep or team. This is how a brokerage maintains quality control at scale without manually reviewing every quote. 

Over time, exception handling also generates useful data. If the same type of request is consistently flagged as an exception, that signals a gap in the pricing logic or the carrier network. 

Function 5: Full Quoting Analytics 

The fifth function is capturing and analyzing 100% of the quoting activity, including requests that did not result in a quote. This is where the RMS closes the feedback loop. 

Most manual quoting operations have fragmented data. Some quotes happen in email threads, others in TMS workflows, and others through portal interfaces that don’t export clean data. The result is that operations leadership can’t answer basic questions: How many rate requests did we receive this week? Where are we winning versus losing? Which lanes are consistently coming in below our markup floor? 

A freight rate management system captures all of this in a unified data layer. Dashboards track quote volume, win and loss rates, response times, expected markup, and shipper network performance across dozens of data points. That data drives better pricing decisions and makes the entire operation easier to manage. 

Frequently Asked Questions About Freight Rate Management System Functions 

What is the most important function of a freight rate management system? All five functions are interdependent, but multi-channel request capture is the foundation. If the system isn’t connected to every channel where requests arrive, the other functions only apply to a subset of the business. 

Can a freight rate management system work without all five functions? A platform missing one of these functions will create a gap that the quoting operation has to fill manually. Exception management is often the first to be underbuilt in lighter-weight tools, leading to unanswered requests and missed loads. 

How does an RMS handle shipper platforms that don’t support API connections? RPA fills the gap. It mimics human interactions with the shipper portal, retrieving and submitting data without requiring a native API. Tabi Connect uses both API and RPA depending on the shipper’s technology. See how the technology works. 

Does an RMS require coding to update pricing logic? No. A well-built RMS uses a no-code interface for pricing logic configuration. Tabi Connect allows parameter updates from any web browser in real time, with no IT involvement required. 

What analytics does a freight rate management system provide? Standard analytics in a freight RMS include quote volume, win and loss rates, response time by channel, expected markup by lane, exception rates, and shipper network performance. Tabi Connect tracks over 48 data points per quote. 

See All Five Functions in Action 

Tabi Connect covers all five core functions of a freight rate management system: multi-channel capture, broker-defined pricing logic, automated submission, exception handling, and full quoting analytics. 

Speak with a Rate Tech Expert now!

Freight quote automation is the use of software, API connections, and rules-based pricing logic to generate and send a freight rate without a person manually pulling data, doing the math, and typing a response. Instead of a rep opening a TMS portal, checking a rate tool, calculating markup, and typing an email, the system does it in seconds and logs the result automatically. 

For brokers, that shift matters more than it did even two years ago. Rate requests now arrive from a shipper’s TMS portal, a bid board, an inbox, and a phone call, often within the same hour, and shippers are rewarding whoever answers first. This guide walks through what freight quote automation actually is, how it works under the hood, what it takes to evaluate a platform, and how to roll one out without losing your team’s trust in the process. 

What Is Freight Quote Automation? 

Freight quote automation is technology that captures a rate request, pulls the data needed to price it, applies a brokerage’s own pricing rules, and returns a quote, without a person doing each of those steps by hand. The request might come from a shipper’s TMS, a load board, an email, or an internal rep typing a quick lookup. The output is the same either way: a rate, a markup calculation, and a record of the transaction. 

This is different from a rate lookup tool that just shows you a market number. Automated freight quoting closes the loop. It takes the market data, your cost basis, and your business rules, and produces a final number that goes out the door, whether that is to a shipper’s portal, an email reply, or a rep’s screen. 

Three things distinguish real freight quote automation from a partial fix: it covers every channel, with email, TMS portals, bid boards, and internal requests all flowing through the same pricing logic instead of separate manual processes; it applies pricing rules consistently, so the same shipper gets the same treatment regardless of which rep or which channel handled the request; and it captures the data automatically, so every quote, win, and loss lands in a reporting layer without someone re-entering it. 

Why Freight Quote Automation Matters Right Now 

Spot and contract rates have been moving closer together, which changes how brokers compete. In the U.S. Bank and DAT Freight & Analytics Q1 2026 rate report, spot rates closed at $1.65 per mile by the end of November 2025 while contract rates held at $2.02 per mile, a narrower gap than brokers saw earlier in the freight downturn (FreightWaves, January 2026). When contract and spot rates sit closer together, shippers have more reason to shop the spot market, and brokers who respond slowly lose that business to whoever answers first. 

Spot capacity is also swinging harder than it has in years. DAT’s load-to-truck ratio hit 9.9-to-1 for the week ending December 6, 2025, the highest point of the current downturn, according to data C.H. Robinson cited from DAT (Heavy Duty Trucking, December 2025). Ratios like that can flip in a matter of weeks. A brokerage that prices manually cannot reprice its entire book that fast. An automated pricing engine can, because the rules update once and apply everywhere immediately. 

Response speed is not unique to freight. A widely cited 2011 Harvard Business Review study of more than 2,200 companies found that firms who contacted a web-generated sales lead within an hour were about 7 times more likely to qualify that lead than firms that waited even 60 minutes, and the average company took 42 hours to respond at all (Oldroyd, McElheran, and Elkington, Harvard Business Review, 2011). That research is not freight-specific, but the underlying dynamic holds in freight quoting too: the shipper who gets a fast, accurate answer tends to book with whoever answered first, not whoever eventually sent the best number. 

How Freight Quote Automation Works 

Automated quoting is built around four layers that work together: capture, pricing, delivery, and reporting. 

Capture is how the request reaches the system, whether that’s an email landing in a shared inbox, a bid posted to a shipper’s TMS portal, a form submission on a self-service rate page, or a rep typing load details into an internal tool. A real automation platform needs to capture all of these, not just one. 

Pricing is where the rate gets built. The system pulls a baseline truck cost from market data, applies the brokerage’s markup rules, layers in accessorials, and produces a final number. This is the layer that used to live entirely in a rep’s head, built from experience and gut feel about a lane. 

Delivery is how the quote goes back out. For a TMS portal or bid board, that means submitting the bid directly. For an email request, that means drafting and sending a reply. For an internal rep, that means displaying the number on screen so they can relay it by phone. 

Reporting captures what happened: the rate quoted, whether it won, and the markup on the load. Without this layer, a brokerage has no way to see which lanes are winning, which reps are quoting the most, or where pricing needs to change. 

The Building Blocks of an Automated Quoting Stack 

A few components make up a complete quoting stack, and skipping one of them usually means falling back to manual work for that piece. 

Rate data connections. The system needs a live feed of market rates to build an accurate baseline. That typically means API connections to sources like DAT, Greenscreens, Truckstop, or a brokerage’s own historical rate data. Tabi Connect’s DAT RateView and RateCast integration is one example of what that connection looks like in practice: real-time market data flowing directly into the pricing engine instead of a rep tabbing between browser windows. 

A pricing logic engine. This is the rules layer: markup targets by lane or shipper, equipment-specific adjustments, accessorial handling, and exception thresholds. The best implementations let a non-technical ops or pricing lead configure these rules directly, without submitting an IT ticket every time a shipper’s terms change. 

Channel coverage. The stack needs to reach every place a quote request shows up, which usually means email, shipper TMS portals, load and bid boards, and an internal tool for reps fielding phone calls. Tabi Connect’s platform breaks this out into separate modules: one for inbox-based requests, one for TMS and bid board connections, and one for internal rep lookups, all governed by the same pricing rules. 

Analytics and reporting. Every quote, win, loss, and exception needs to land somewhere a pricing lead can actually use it. That is what turns automation from a time-saver into a strategy tool: you can see which lanes are winning, where markup is tightest, and which channels are underperforming. 

API vs RPA: Which Connection Type Do You Need? 

Most freight quote automation relies on one of two connection methods to reach a shipper’s system, and most brokerages end up needing both. 

API connections talk directly to a shipper’s platform on the back end. They are fast, typically returning a rate in about 3 seconds, and they do not break when a shipper redesigns their portal, because the connection happens below the visible interface. The tradeoff is that an API only exists where a shipper has built one, and setup can take 1 to 2 weeks per connection. 

RPA (robotic process automation) connections work by mimicking what a person would do on screen: logging in, entering load details, and submitting a bid, the same way a rep would. RPA is slower, roughly 35 to 50 seconds per quote, and requires more upkeep, since a portal redesign can break the automation until it’s rebuilt. But RPA covers shipper platforms that do not have an API available, which in practice is most of them. 

Electronic Data Interchange (EDI) is a third, older option still used in some legacy freight tech stacks. It works, but it is expensive to maintain and slow to adapt to new requirements, which is why most modern quoting platforms lean on a mix of API and RPA instead. For a deeper look at how the three compare, see this breakdown of RPA, API, and EDI in logistics. 

The practical takeaway: a brokerage quoting across 60 or more shipper platforms will have some API connections and a larger number of RPA connections, because API coverage still lags shipper adoption. A platform that only supports one connection type will always have gaps. 

Common Freight Quote Automation Use Cases 

Freight quote automation shows up in a handful of recurring scenarios inside a brokerage: 

Inbox-based quoting. A shipper emails a rate request with load details in the body of the message. Automation extracts the origin, destination, equipment type, and dates, prices the load, and drafts a response, often in under 10 seconds, without a rep opening a second tab. 

TMS and bid board bidding. Shippers post loads to their own TMS or a public bid board. Automation logs in (via API or RPA), reads the load details, applies pricing rules, and submits a bid, around the clock, including outside business hours when a rep would not otherwise be watching. 

Internal quick-quote lookups. A customer calls and asks for a rate on the spot. Instead of the rep pulling up multiple tools, an internal quoting tool returns a full rate breakdown, baseline cost, market rate, and markup, in a couple of seconds. 

Shipper self-service portals. Larger shippers get a branded rate window embedded on the brokerage’s site or sent as a link. The shipper enters load details and gets an instant rate without an email chain. 

Rebidding on closed opportunities. Some bid boards let a broker see and adjust an offer even after a shipper has closed the bidding round to new entrants. One Tabi Connect customer using this kind of rebid functionality went from winning 5 of 929 submitted offers to winning 76 of 561, a roughly 15x increase in win rate, after automating that follow-up bidding process. 

Bulk and RFP quoting. When a shipper sends a spreadsheet of hundreds of lanes for a bid package, automation applies the same pricing logic across every line at once instead of a team working through it lane by lane. 

What Freight Quote Automation Does to Margin 

Manual quoting doesn’t erode margin through one bad pricing call. It erodes it through inconsistent quoted markup, repeated across the business in smaller ways than any single decision would suggest, which is exactly the argument laid out in Tabi Connect’s own margin protection guide for freight brokers. A few of the most common leaks: freight that never gets quoted because there isn’t time to get to it, markup that varies by which rep handles the request instead of a consistent strategy, quotes that go out late in the cycle and end up competing on price instead of speed or service, accessorials and edge cases applied inconsistently across hundreds of quotes, and no single view of what was quoted, won, or lost across every channel. 

Automation does not remove judgment from pricing. It removes the variability that comes from doing the same process by hand, at different speeds, with different assumptions, every time. 

How to Evaluate a Freight Quote Automation Platform 

Not every automation vendor covers the same ground. A few questions are worth asking before signing anything: 

How many shipper platforms does it actually connect to, and through what method? Ask specifically about the mix of API versus RPA connections, since that tells you both coverage and long-term maintenance burden. 

Where do the rates come from? A platform should support your existing rate subscriptions (DAT, Greenscreens, Truckstop, and similar) plus your own historical data, not force you onto a single proprietary data source. 

Does changing pricing logic require code or an IT ticket? If a pricing lead cannot update a markup rule from a browser without involving a developer, that rule change will take days instead of minutes. 

What does implementation actually require from your team? Ask about IT lift specifically. A well-built platform should handle its own infrastructure and API build-out rather than asking your internal team to manage servers or connections. 

Is there a pilot option? A 30-day pilot with no long-term contract is a reasonable ask, and it’s a fair way to validate a platform against your actual shipper mix before committing. 

How does pricing scale? Per-shipper pricing lets a brokerage add automation gradually instead of paying for capacity it does not need yet. 

These evaluation questions matter more than any single feature, because the gap between vendors usually shows up in how they handle these operational details, not in the marketing copy. If you’re building this into a wider plan, it’s worth pairing this evaluation with a broader freight brokerage strategy, so pricing automation supports the goals you’ve already set rather than becoming a separate initiative. 

Getting Started: Rolling Out Freight Quote Automation Without Disrupting Your Team 

The biggest risk in a quoting automation rollout is not the technology. It’s adoption. A system that reps do not trust gets worked around, and a system imposed from the top without input tends to face quiet resistance long after go-live. 

A few things make rollout go more smoothly: give reps visibility into how a quote was built, since if a rep cannot see the baseline cost, the market rate, and the markup behind a number, they will not trust it and will default back to their own manual process. Bring reps in early, not after the decision is made, since teams that had a hand in shaping how pricing rules got set up tend to adopt the system faster than teams who had it handed to them. Start with the channel causing the most pain, since most brokerages get the fastest win by automating whichever channel is generating the most manual volume right now, usually email or TMS portal bidding, rather than trying to launch every module at once. And track more than time saved: the real return shows up in quote coverage, meaning how much available freight actually gets quoted, consistency, meaning whether similar freight gets priced similarly across reps, and visibility, meaning whether leadership can see win rates and markup by lane. For more on building change management into a rollout, see this guide to successful automation. 

Most implementations run 4 to 5 weeks from signed agreement to live, and a 30-day pilot is a reasonable way to test the process with your actual shipper mix before rolling it out brokerage-wide. You can find current Tabi Connect pricing and a look at customer case studies if you’re comparing options. 

For terminology used throughout this guide (rate engines, pricing logic, spot rates, and more), the freight technology glossary has plain-language definitions for each term. 

Frequently Asked Questions 

What is freight quote automation? Freight quote automation is software that captures a rate request from any channel (email, a shipper’s TMS, a bid board, or an internal tool), applies a brokerage’s pricing rules, and returns a quote without a person manually pulling rates and doing the math. 

How fast can an automated freight quote be generated? It depends on the connection type. API-based quotes typically return in about 3 seconds. RPA-based quotes, used for platforms without an API, generally take 35 to 50 seconds. Internal quick-quote tools for reps fielding phone calls can return a full rate breakdown in about 2 seconds. 

Does freight quote automation replace the need for pricing judgment? No. It applies a brokerage’s existing pricing rules consistently and quickly. Reps and pricing leads still set the strategy, markup targets, and exceptions; automation just removes the variability of applying those rules by hand across hundreds of quotes a day. 

What’s the difference between API and RPA for freight quoting? API connections talk directly to a shipper’s backend system and are fast and stable, but only exist where the shipper has built one. RPA mimics a human clicking through a shipper’s portal, which covers more platforms but runs slower and needs more maintenance when a portal changes. 

How long does it take to implement a freight quote automation platform? Most implementations take 4 to 5 weeks from signed agreement to go-live. Many vendors, including Tabi Connect, offer a 30-day pilot program to test the platform against your actual shipper mix before committing to a longer contract. 

Can freight quote automation work with our existing rate subscriptions? Yes, in most cases. A well-built platform should connect to rate sources you already subscribe to, such as DAT, Greenscreens, Truckstop, or Sonar, rather than requiring you to replace them. 

Will automating quotes require our IT team to build anything? It shouldn’t require much. Platforms built for freight brokerages typically handle their own infrastructure, virtual machines, and API connections, so the IT lift on your side stays minimal. Ask any vendor directly what their implementation actually requires from your team before signing. 

Ready to see how automated quoting would work across your specific TMS and bid board connections? Book a demo with Tabi Connect to walk through your own lanes. 

Most conversations about freight quoting software integration focus on speed: API versus RPA, how fast a connection returns a rate, how long onboarding takes. What gets left out is cost, specifically a cost that shows up on the shipper’s side of the connection, not the vendor’s. A number of major shipper TMS platforms, including E2open and Blue Yonder, charge a fee for third-party API access. That fee exists whether your quoting vendor absorbs it, negotiates it down, or quietly passes it straight through to you as an integration surcharge. Most brokers never ask which one is happening. 

Why Shipper TMS Platforms Charge for API Access 

A shipper’s TMS is built primarily to run their own operation, not to serve as free infrastructure for every broker who wants a live connection into it. Platforms like E2open and Blue Yonder have built out API access as its own line of business: a broker or their quoting vendor pays for a connection into the shipper’s system, on top of whatever the shipper themselves is paying to run the platform. 

That’s a legitimate cost of doing business for the platform. It becomes a problem for a brokerage when a quoting vendor treats it as a pass-through cost by default, folding it into your integration fee without ever telling you it’s a separate line item that varies by shipper platform, not something intrinsic to the connection itself. 

The Question Most Brokers Never Ask a Vendor 

When you’re evaluating a quoting software vendor, “does this connect to E2open” or “does this connect to Blue Yonder” is the wrong first question. The right one is: who is paying the API access fee on that connection, and is it built into my subscription or billed to me separately as a pass-through. 

This matters more than it looks like it should, because API access fees are not trivial and they scale with the number of shipper platforms you connect to. A brokerage running API connections to a dozen major shipper TMS platforms that each charge separately for access can end up paying for the same kind of connectivity multiple times over, once to the vendor for the integration work and again, indirectly, for every shipper platform’s access fee the vendor passes through. 

A vendor with enough integration volume across its customer base has real leverage to negotiate these fees down, the same way any company with scale negotiates better terms than a single customer could get alone. Whether a vendor actually does that negotiating, or just quotes you the sticker price plus their margin on top, is one of the clearest signals of whether they’re building genuine infrastructure or reselling someone else’s. 

What to Ask a Vendor About Connectivity Costs 

A few direct questions surface the answer faster than reading a features page: 

Do you have existing API relationships with major shipper TMS platforms like E2open and Blue Yonder, or would this be a new connection built from scratch for us? A vendor with established relationships has already done the negotiating that a first-time build hasn’t. 

Is the shipper platform’s API access fee included in our subscription, or billed separately? Ask for this in writing, the same way you’d ask for implementation cost separate from the subscription fee. 

If a new shipper platform we want to connect to charges for API access, do you negotiate that on our behalf, or pass along whatever they quote? This tells you whether the vendor is actively managing your connectivity costs or just facilitating them. 

Where This Fits Alongside API, RPA, and EDI 

The connection type still matters. API connections are fast and stable and don’t break when a shipper redesigns their portal. RPA mimics what a rep would do on screen and covers platforms without an API, at the cost of more maintenance. EDI still shows up in some legacy freight tech stacks. All of that is the mechanical side of integration, and it’s the side most vendor comparisons stop at. 

The cost side is separate and usually invisible until a brokerage is well into a contract. A vendor quoting a lower base subscription can end up costing more once you’re connected to several fee-charging shipper platforms and paying the pass-through on each one, the same way a quote that looks cheaper can hide per-integration fees that weren’t in the base price. Connectivity cost belongs in the same conversation as implementation cost and the year-two tier upgrade: a number that’s easy to miss upfront and expensive to discover later. 

Frequently Asked Questions 

Ready to see what your actual connectivity cost looks like against your specific shipper mix, including platforms like E2open and Blue Yonder? Book a demo with a Tabi Connect Rate Tech Expert and bring your shipper list. 

Freight quoting software pricing runs from a few hundred dollars a month for a handful of seats to five- and six-figure annual contracts once you add API-connected shippers, and the number that matters is not the sticker price, it’s the cost per quote at your actual volume once implementation, training, and the inevitable mid-contract tier upgrade are factored in. This guide covers the procurement side of the decision: what this software actually costs, the contract terms worth negotiating before you sign, and a scorecard for comparing vendors on the criteria that actually predict whether the tool gets used. 

If you’re still evaluating what a rate management system is or how it differs from your TMS, see what a rate management system is and rate management system and a TMS for that foundation. 

How Freight Quoting Software Is Actually Priced 

Pricing in this category is almost never a flat per-user fee, because the cost to the vendor scales with quote volume and integration count, not seat count. The table below reflects the range this typically falls into, not any single vendor’s list price. 

Pricing factor Lower cost Higher cost 
Shipper connections A handful of shippers, mostly email-based 40 or more shipper platforms, mostly API-connected 
Quote volume Dozens of quotes per day Hundreds to thousands per day 
Pricing logic complexity Simple markup percentage, few exceptions Lane-level rules, accessorial logic, 40+ parameters 
Integration type Standard API to a common TMS Custom RPA builds for proprietary shipper portals 
Analytics depth Standard dashboards Custom reporting, full funnel analytics 

Three cost components are easy to miss when comparing a sales quote against a budget line: 

Implementation cost separate from the subscription fee. Some vendors bundle onboarding into the subscription. Others charge a one-time implementation fee that can run from a few thousand dollars for a standard integration to well into five figures for multiple custom RPA connections. Ask for this number in writing, separate from the recurring fee, before you compare pricing. 

The tier upgrade you’ll likely need within a year. Most brokerages underestimate their quote volume growth when they first price out a system. If your shipper count or quote volume grows 30 to 50% in year one, which is common after quoting stops being a bottleneck, confirm what the next tier costs. 

The cost of the integrations you don’t ask about upfront. A quote that looks 20% cheaper than a competitor’s can end up costing more once you add per-integration fees for shipper platforms that weren’t included in the base price. 

What This Costs Over Three Years: A Worked Example 

Sticker price comparisons fall apart over a multi-year contract, because the number that started the conversation isn’t the number you’re actually paying by year two. Here’s a directional example for a mid-size brokerage starting with 15 shipper connections and growing to 25 over three years, not a quote for any specific vendor. 

 Year 1 Year 2 Year 3 
Subscription tier Entry tier, 15 shippers Mid tier after growth past entry cap Mid tier, stable 
One-time implementation Included in first-year cost None (already implemented) None 
New integration builds None beyond initial rollout 2 to 3 new shipper connections 1 to 2 new shipper connections 
Renewal increase N/A Per contract’s annual increase clause Per contract’s annual increase clause 

The pattern worth planning for: year one is usually the cheapest year you’ll have with this vendor, both because you’re on the entry tier and because you haven’t yet hit the growth that pushes you into the next pricing bracket. Budgeting as if year one’s cost is representative of years two and three is the single most common way this line item surprises a CFO. Tabi Connect’s pricing page shows what’s included at each tier as a starting reference point for building your own three-year model. 

The Real Cost of Getting This Decision Wrong 

Getting the vendor choice wrong doesn’t usually show up as a failed rollout. It shows up as a tool your team routes around. In G2’s 2026 Software Buying Trends Survey of 3,385 decision-makers, only one in three buyers reported successfully adopting new software without disruption or regret, and 61% had experienced implementation disruption in the prior 18 months (G2 Digital Markets, 2026). 

That statistic isn’t specific to freight, but the mechanism is the same one that shows up in freight quoting rollouts: a system gets purchased against a features list, then the operational reality (a pricing exception the rules engine can’t handle, an integration that was “supported” but not actually tested against your TMS version) surfaces after the contract is signed, not before. 

Due diligence aimed at the specific failure points below is what closes that gap, because that’s where it actually opens up. 

What Actually Separates Vendors: AI-Assisted Pricing, Not Just Editable Rules 

Most freight quoting software vendors will tell you their pricing logic is configurable. That’s table stakes, not a differentiator, and it undersells what’s actually possible in this category now. The more useful question is whether the platform helps a pricing lead find the right rule in the first place, or just gives them a form to type one into. 

There’s a real difference between a rules engine that requires someone to already know the answer, and one that uses your own historical quote and win data to suggest where a markup target is too aggressive on a lane, where a lane is winning consistently and could bear a higher markup, or where an accessorial rule is triggering more exceptions than it should. Tabi Connect’s Control Tower is built around this: semi-automated quoting that surfaces a recommended number and lets a human approve it, rather than either forcing a rep to build the number from scratch or removing their judgment from the process entirely. The goal isn’t a system that replaces pricing decisions. It’s one that makes the person setting them faster and more consistently right, using data most brokerages already have but aren’t using. 

When you’re evaluating vendors, ask this directly: does the platform only apply rules you write, or does it help you write better ones? A vendor that can’t answer beyond “you can edit the rules anytime” is describing a form, not a decision-support tool. 

A Freight Quoting Software Vendor Evaluation Scorecard You Can Actually Use 

Score each vendor 1 to 5 on each criterion, multiply by the weight, and total it. This turns “we liked the demo” into a comparison you can actually defend to whoever signs the check. 

Criterion Weight What a 5 looks like What a 1 looks like 
Live integration to your specific TMS and top 5 shippers 20% Tested, working connection demonstrated live “We can build that” with no committed date 
Omnichannel request coverage: email, shipper TMS, internal lookups 15% Every channel where a quote request lands runs through the same pricing logic One channel automated, the rest still manual 
Pricing logic your team can edit, and that helps you set it right 20% Browser-based rule changes, plus data-driven recommendations on markup targets Every change requires a vendor support ticket, and the vendor has no view on whether the rule is good 
Role-based access and governance 10% Granular control over who can view, edit, or approve pricing logic by role One shared login, no distinction between a rep and a pricing lead 
Reporting and actionable analytics 15% Full funnel: requests in, quoted, won, lost, by shipper, lane, and channel, with clear next-action signals Win/loss totals only, no request-level data 
Total cost at your actual volume, all-in 10% Written quote covering subscription, implementation, and next-tier cost Verbal range with “it depends” on the details 
Implementation timeline tied to your integration list 5% Dated project plan matched to your specific shippers and TMS Generic “4 to 6 weeks” with no specifics 
Reference customer at your size and complexity 5% Named reference willing to discuss rollout, not just results Logo on a slide, no reference call offered 

A vendor that scores well on the demo but poorly on this scorecard is telling you something the demo won’t: that the gap between what they showed you and what you’ll actually get is wider than it looked in the room. This scorecard is deliberately weighted toward the criteria that determine whether the tool becomes a real decision-support layer for pricing, not just a faster way to send the same rules you already had. If you also want a feature-by-feature checklist for comparing platform capabilities directly, Tabi Connect’s evaluation checklist covers that ground in more detail. 

Why Role-Based Access Matters More Than It Looks Like It Should 

A pricing and markup strategy is only as protected as the system that enforces it. If every rep can edit a lane’s markup rule, or if there’s no record of who changed what and when, the pricing logic a brokerage spent weeks building starts drifting the first week reps have their hands on it. 

Look for a system that lets you define who can view quoting activity, who can propose a rule change, and who has final approval on markup targets and exception thresholds, mapped to actual roles: rep, pricing lead, operations manager. This isn’t a compliance checkbox. It’s what keeps the pricing strategy a brokerage designed from quietly becoming whatever forty individual reps decided it should be. 

Build vs. Buy: Why Most Brokerages Land on Buy 

Building a pricing and quoting system internally comes up in almost every vendor evaluation, usually from whoever owns the engineering budget and wants to avoid a recurring software line item. It’s worth a real answer. 

The case against building: quoting software isn’t a one-time build, it’s an ongoing maintenance commitment, since shipper platforms change their portals, market data sources update their APIs, and your own pricing logic will need to evolve as your business does. A vendor with dozens of customers running similar workflows has already solved the shipper integration problem you’d be solving from scratch, and their roadmap is funded by many customers’ worth of subscription revenue, not your engineering team’s spare capacity. Most brokerages that actually run the build-vs-buy math land on buy once they price in year two and three maintenance, not just the initial build. 

The exception: a brokerage with a genuinely unusual pricing model that no vendor’s rules engine can accommodate, and enough engineering capacity to treat this as a real product, not a side project. That’s a narrow case. Most brokerages evaluating this decision are not in it. 

Contract Terms Worth Negotiating Before You Sign 

Termination and data portability. Confirm you can export your quoting history, pricing rules, and shipper connection configurations if you switch vendors later. A contract that locks your pricing logic inside a proprietary format you can’t export is a switching cost you’re agreeing to sight unseen. 

What happens when a shipper platform changes. RPA integrations break when a shipper redesigns their portal. Ask who is responsible for rebuilding the connection, on what timeline, and whether that’s covered under your existing contract or billed as a change order. 

Price protection on renewal. Multi-year software contracts commonly include an annual increase clause. Know the number before you sign, not when the renewal invoice arrives. 

Minimum commitment versus actual usage. If the contract has a minimum shipper count or quote volume commitment, confirm it matches your realistic ramp-up, not the number the sales team used to get you into a better tier. 

Who owns pricing logic changes after go-live, in writing. A verbal assurance that “you can update rules anytime” isn’t the same as a contract clause guaranteeing browser-based, no-ticket rule changes, tied to specific roles. If access control and rule ownership matter enough to weight on the scorecard above, they matter enough to get in writing. 

Contract Length: Month-to-Month vs. Multi-Year 

Vendors typically offer a discount for locking into a multi-year term, and whether that trade makes sense depends on how confident you are in the fit after your evaluation, not just the discount percentage. 

A multi-year contract makes sense when you’ve run a real evaluation (the scorecard, the reference calls, a demo against your own quote data) and the vendor has already proven the integrations that matter most to you. Locking in a lower rate for two or three years is a reasonable trade once you’ve done that work. 

A shorter initial term, even at a higher monthly rate, makes sense when a specific integration is unproven, when your shipper count or quote volume is likely to change significantly in the next year, or when the vendor pushed hard for a multi-year commitment before you’d finished your own evaluation. A vendor confident in their product should be comfortable earning a longer commitment after a shorter initial term proves out, rather than requiring the long term upfront. 

Either way, tie the contract length to something you can verify, not just the discount offered. “We’ll sign a two-year term once our top 5 shippers are live and tested for 30 days” is a stronger negotiating position than agreeing to a multi-year term based on a sales demo alone, and it gives you a clean, contractually clear way to walk away if that 30-day test doesn’t hold up. 

How Long This Should Actually Take 

Rushing a decision and dragging one out both create real cost. Per G2’s 2026 research, buyers who successfully adopt new software typically narrow their search to three vendors and decide within three months (G2 Digital Markets, 2026). That’s a useful benchmark: if you’re still adding vendors to your list at week eight, the search has lost focus. If you’re being asked to sign within a week of a first demo, that’s a signal the vendor is selling faster than they can actually implement. 

A reasonable timeline looks like: two to three weeks identifying and narrowing to three vendors, two to four weeks running structured demos against your own quote data (not vendor sample data), one to two weeks on the scorecard above and reference calls, and final contract negotiation before signature. Ten to twelve weeks total is realistic for a mid-size brokerage. Longer than that usually means the requirements weren’t clear at the start, not that the vendors are all equally hard to evaluate. 

Frequently Asked Questions 

Ready to see a live quote against your own shipper list and pricing rules instead of a sample dataset? Book a demo with a Tabi Connect Rate Tech Expert and bring your RFP questions with you.